

.jpg?width=40&height=40&name=Headshot%20-%20Peter%20Jebson%20(1).jpg)
Today more than 23% of all auto insurance claims are deemed a total loss, and more than 40% of policyholders switch carriers after a total loss claim – compared to just 8% after a repairable claim1. That adds up to over 2 million policyholders walking out the door every year because of how their total loss was handled – compared to just 1 million after a repairable claim. 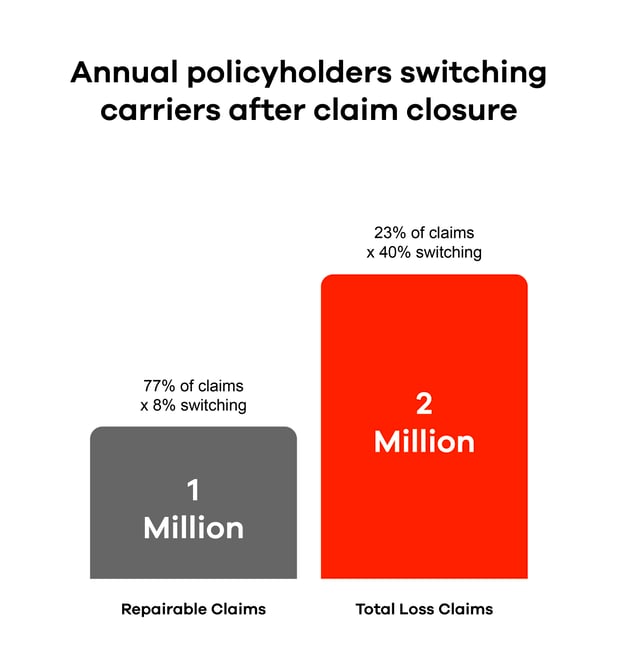
A decade ago, when total losses represented 10%-15% of all claims, a singular focus on Net Salvage Return was a reasonable strategy. Today it is not. With total losses now over 23% of claim volume and driving the highest shopping and switching rates in auto insurance, any friction in a total loss claim is an invitation for a competitor to step in and win the policyholder.
The good news: Policyholder Retention and Net Salvage Return are not mutually exclusive. Both are driven by Cycle Time – particularly at a few key milestones in the total loss process.
Cycle Time Drives Everything That Matters
62% of dissatisfied insureds in total loss claims cite ‘speed of payment’ as their top priority2. That single data point should reframe how organizations think about salvage operations not as a back-office recovery function, but as a front-line driver of Policyholder Retention. Speed to payment is measured as Cycle Time to Settlement.
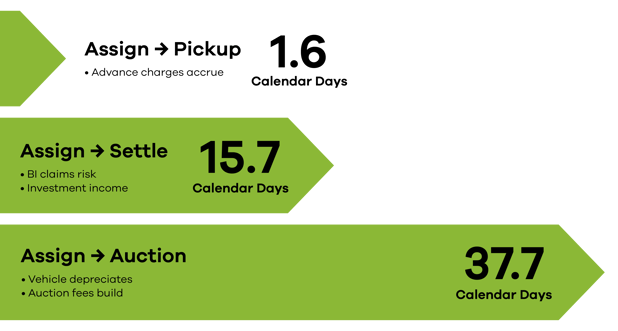
Net Salvage Return is also driven by Cycle Time at a few key milestones in the total loss process:
- Gross Salvage Return is driven by Cycle Time to Auction. Longer storage equates to more vehicle depreciation ($47 per month), and higher yard costs – which ultimately get passed to buyers and put a downward pressure on auction prices (to the tune of $850 to $1,085 on an average total loss vehicle at auction3,4)
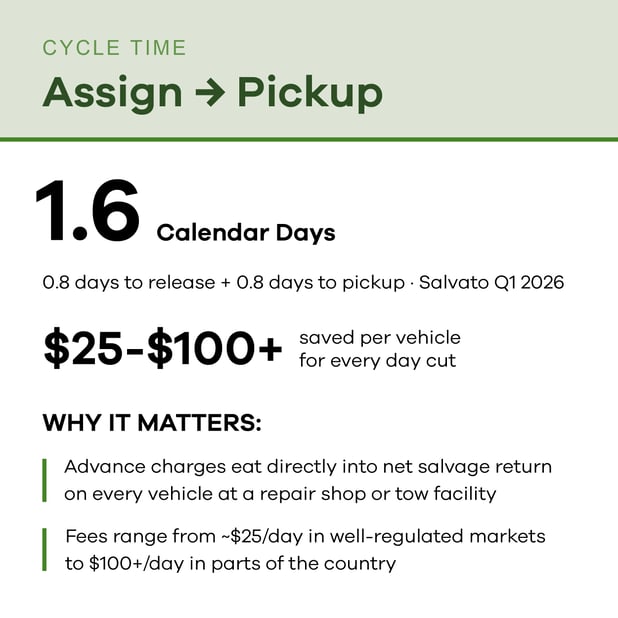
- Advance Charges are of course driven by Cycle Time to Pickup – with repair shops and tow companies charging $25 to $100+ per day across the U.S.
- Finally, Auction Fees are also driven by Cycle Time to Auction – with higher yard costs getting passed through primarily to buyers and depressing auction prices (above), but also getting passed through to insurance carriers in the form of Program Fees, Title Services Fees, and so on.
For these reasons, Salvato Auctions is publishing aggregated performance data across all our customers on the metrics that matter in total loss claims, and translating each metric into its dollar impact on insurance carriers’ bottom line.
If you would like to see the impact using your own numbers, you can use the Salvato Scorecard at SalvatoInc.com/Sellers to generate a report for your portfolio.
Higher Investment Income
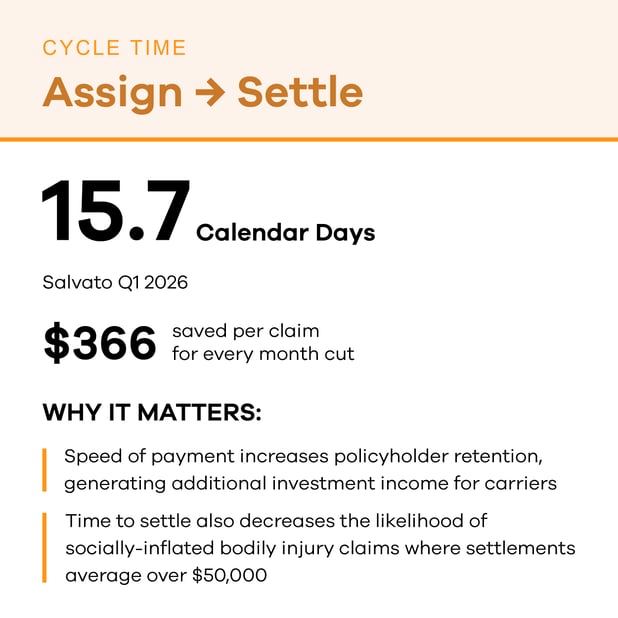
- Every policyholder retained after a total loss is worth an average $385 investment income to the carrier’s bottom line5
- 40% of insureds switch insurance carriers after a total loss claim (compared to 8% on a repairable claim), and 62% of dissatisfied insureds cite ‘Speed of Payment’ as their top priority in a total loss claim
- Settling total loss claims at least as fast as it takes to resolve repairable claims for owners (average 19 days6), is therefore critical to reducing churn from 40% down to 8% for these customers
Fewer Socially-Inflated Bodily Injury Claims
- More than 36% of Personal Injury Protection (PIP) claimants and 50% of Bodily Injury (BI) claimants are represented by attorneys7, and the average BI claim settlement when lawyers are involved is over $50,0008
- 15% of claimants say they engaged a lawyer because of delays getting the claim settled, and another 33% said it was suggested to them by someone they know – so settling the claim faster reduces the window of time for this to occur9.
- That means that even a 1% reduction in lawyer-involved BI claims due to settling the vehicle faster, has an impact of $243 per total loss claim.
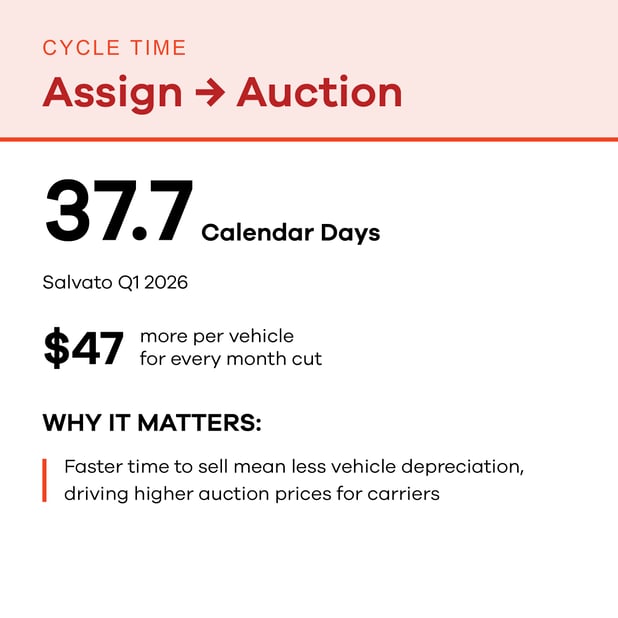
- Salvage vehicle values depreciated by between -9% and -18% annually in 2025, according to IAA10
- In a year when average auction prices were just below $4,200 across the industry, that equates to an average $47 in higher auction prices for every month of cycle time saved.
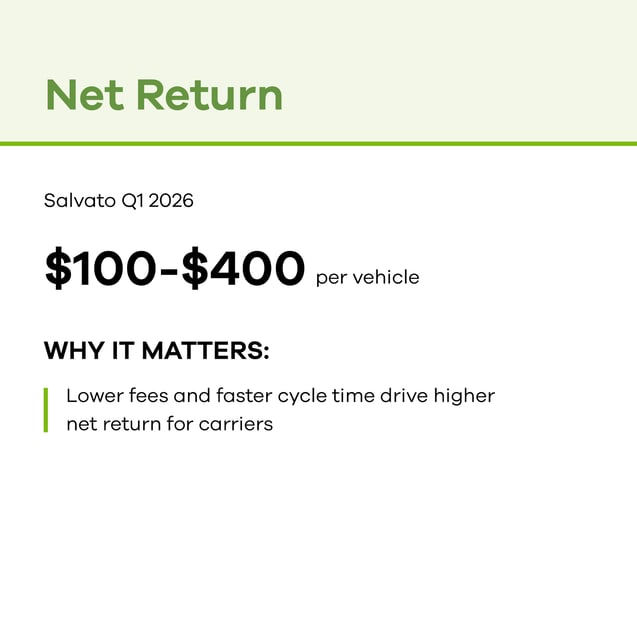
- Every carrier’s mix of vehicles is different, so relative improvement vs. each carrier’s prior auction is what matters. This improvement has been driven by:
- Gross Return: In a quarter where industry-wide auction prices averaged 28.5% to 28.9% of Actual Cash Value, Salvato’s gross salvage return was higher than the industry due to: (A) lower buyer fees leading to higher willingness-to-bid ($200+ on an average total loss vehicle at auction11); and (B) faster cycle time leading to less vehicle depreciation ($47 per month of cycle time saved, as detailed above)
- Advance Charges: Driven by Cycle Time from Assign to Pickup ($25 to $100+ per day, as detailed above)
- Auction Fees: Varies widely, but typically $100 to $200 lower for the majority of carriers in the market.
Total loss claims are a defining moment in the policyholder relationship, and a major lever on your bottom line. Every day of cycle time you shave pays dividends in: higher auction returns, lower advance charges, higher policyholder retention, and fewer inflated B.I. claims. The carriers that treat total loss as a strategic priority and not just a recovery function will be the ones that turn a historically painful customer experience into a retention advantage. If you're ready to see where your portfolio stands, run your numbers through the Salvato Scorecard and find out what faster cycle times could mean for your book of business.

From Assignment to Auction: Modernizing The Total Loss Experience

Salvato Auctions Revolutionizes Total-Loss Vehicle Auctions with New Timed Auction Platform and 20% to 40% Lower Auction Fees
%20(3).png)